


ZStack Cloud Platform
Single Server, Free Trial for One Year

Comprehensive product documentation and tools

Upholding the value of Customer First and the mission of Serving Customer, ZStack is dedicated to providing secure and stable services for customers.

To educate ZStack partners and interested individuals about cloud computing and to cultivate cloud computing talent.

ZStack provides innovative cloud infrastructure for ten major industries

The report provides three major
solutions and customer case studies for transitioning from VMware to ZStack.
For scenarios requiring collection of management node logs through a log server to analyze the Cloud health status, you can use the following solution.
You need to deploy the latest ZStack Cloud environment and a Syslog log server.
syslog server on your log server.syslog server on your log server. You need to prepare a log server for receiving log information in advance, and ensure that the syslog server is installed on it.
#$ModLoad imudp #$UDPServerRun 514$ModLoad imudp $UDPServerRun 514local1.* /var/log/test.logsystemctl restart rsyslog
 Note: If the Cloud UI reports a Log server unreachable error during log server addition, you need to run the following command on the log server to enable 7/tcp port listening for Inet Address isReachable:
iptables -I INPUT -p tcp --dport 7 -j ACCEPTfirewall-cmd --zone=public --add-port=7/tcp --permanent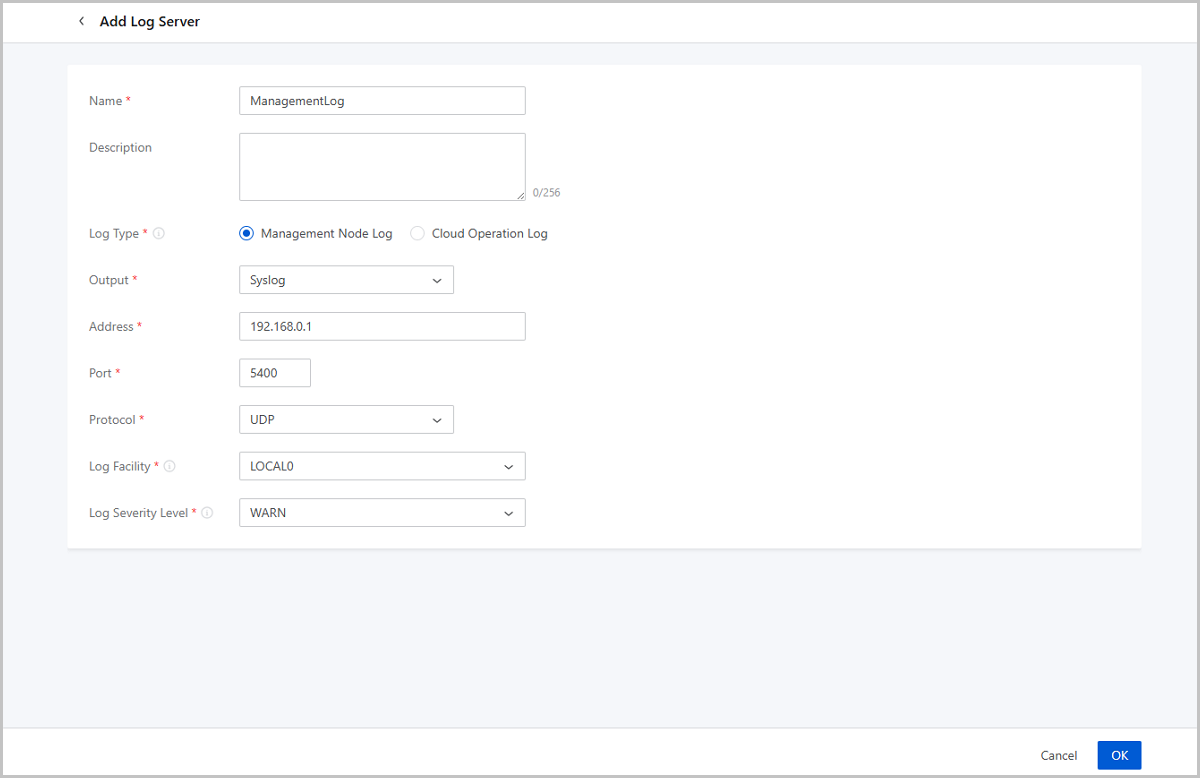
cat /var/log/test.log
A project requires a log server to collect platform operation logs for auditing project member activities.
| Configuration Item | Configuration Details |
|---|---|
| Project Name | Project-1 |
| User Name | User-1 |
| Log Server Type | Loki |
| Log Server IP | 172.xx.xx.145 |
| Log Server Port | 3100 |
| Visualization Tool | Grafana |
Set up a log server in advance to receive logs. In this scenario, use a Loki log server.
Note: Ensure the project member has log server operation permissions.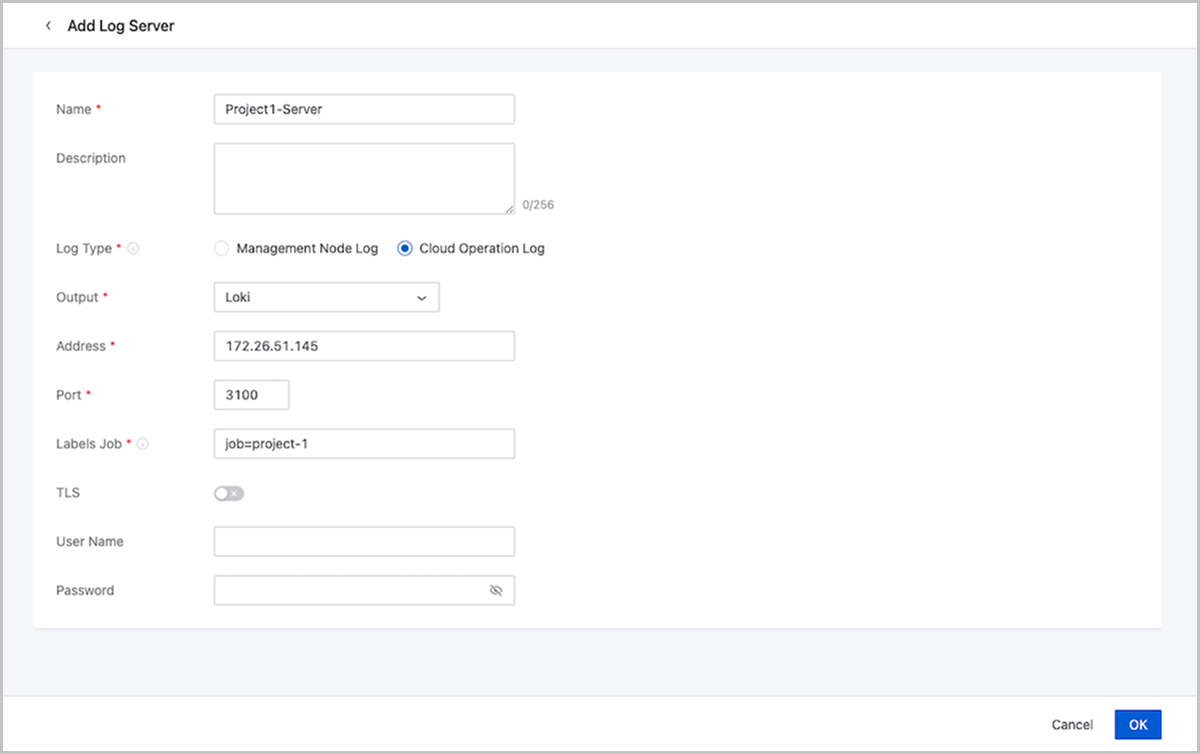
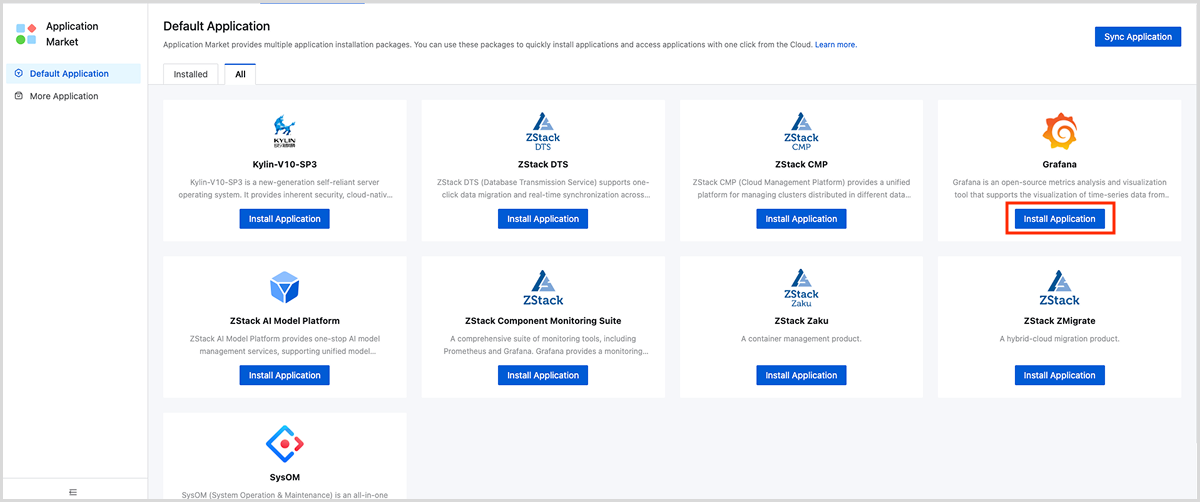
Log in to Grafana. When installed via Application Market, use the default credentials:
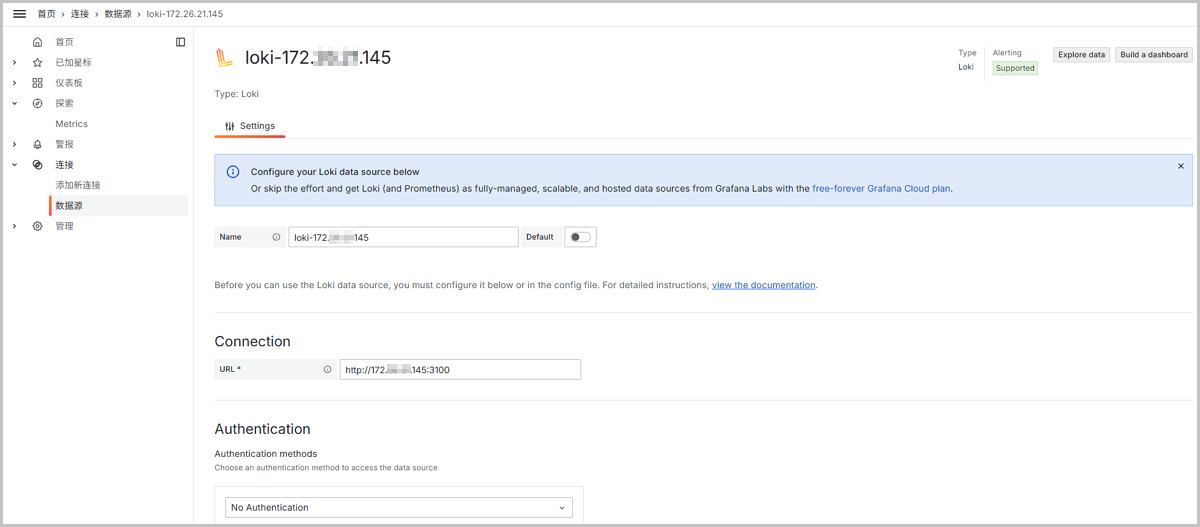
On the Data Sources page, click Add new data source and select Loki as the type.
On the Grafana main menu, click Explore. On the Explore page:


