Management Node Monitoring

In a dual-management node HA scenario, you can intuitively view the health status of each management node.

The management node monitoring supports displaying the management node IP, node status, VIP, and management service status for multiple management nodes. The main management services include:
  • Arbiter Gateway Reachable: Monitors whether the arbitration IP of the active-standby management node is reachable. If unreachable, it may cause the high availability feature of the management node to fail.
  • Peer MN Reachable: Monitors whether the standby management node is reachable. If the standby management node is unreachable, communication with the standby node will not be possible.
  • VIP Reachable: Monitors whether the VIP is reachable. If the VIP is unreachable, the primary management node cannot access the UI interface via the VIP.
  • Database Status: Monitors the status of the database. If the database is abnormal, there may be a risk of data loss. Please restore the fault promptly.

Monitoring and Alarm

Monitoring and alarm supports monitoring time-series data (such as resource load and capacity data) and predefined system events. It pushes alarms to specified endpoints through the SNS. The supported alarm types include resource alarm, event alarm, and extended alarm. Supported endpoint types include system, email, DingTalk, WeCom, Lark, Webhook, SMS, Microsoft Teams, and SNMP Trap. Some resource alarms require an installed agent to function.

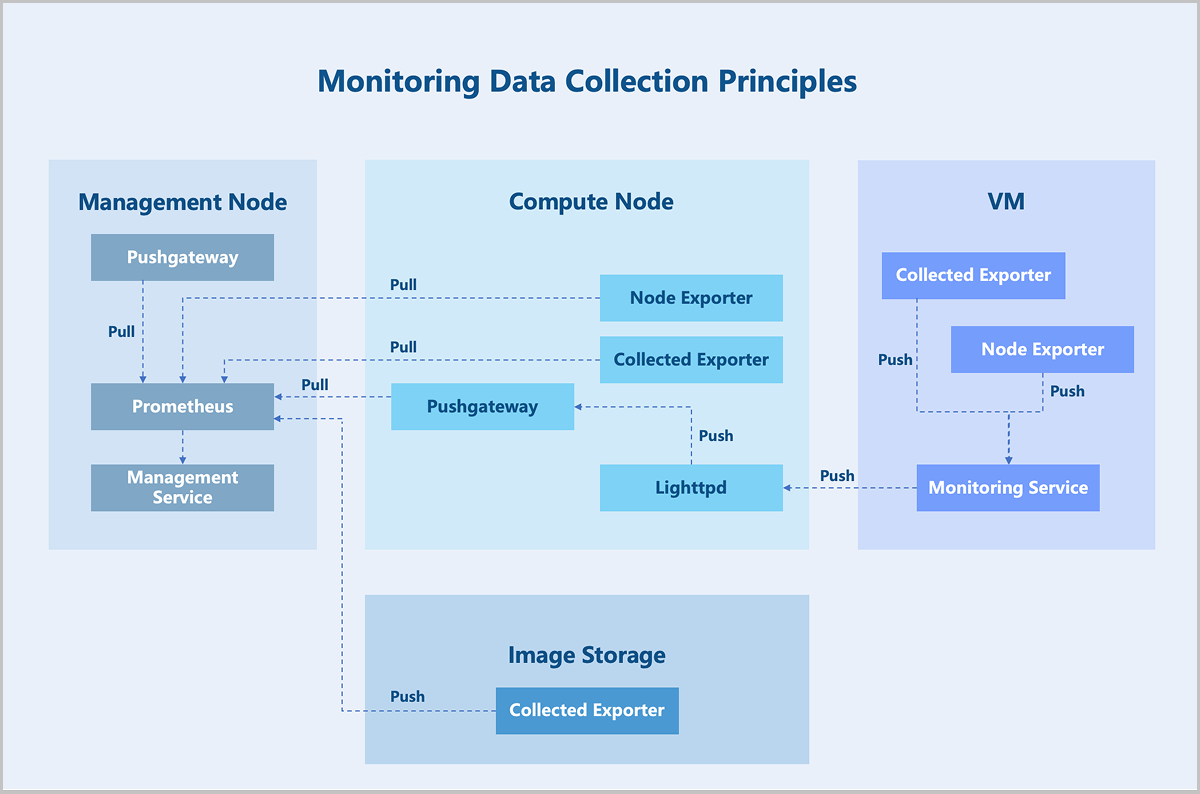
Prometheus provides time-series monitoring data. When monitoring business data, Prometheus uniformly collects different data.

In the Prometheus architecture, the Prometheus server does not directly monitor specific targets. Its core functions are data collection, storage, and providing external data query support. Therefore, to acquire sample data, such as the host CPU usage, an Exporter is used to periodically gather monitoring samples. ZStack ZSphere employs both pull and push modes to collect monitoring data from different monitoring targets. When hosts or external VM metrics are the monitoring targets, the Prometheus service periodically uses the pull mode to collect data gathered by the Exporter on the hosts. Additionally, due to network or security constraints, Prometheus might not be able to directly access the interiors of VMs. In such cases, a Pushgateway acts as an intermediary to facilitate data transfer. The data collection agent still uses an Exporter to gather monitoring metrics but employs a push mode to periodically send this data to the Pushgateway. Prometheus then uses its pull mode to collect the data from the Pushgateway, thereby achieving unified data collection.

Figure 1. Monitoring Data Collection Principles


Archives

Download Document Archives

Download

Already filled the basic info?Click here.

Enter at least 2 characters.
Cannot be empty.
Invalid mobile number.
Enter at least 4 characters.
Invalid email address.
Wrong code. Try again. Send Code Resend Code (60s)

An email with a verification code will be sent to you. Make sure the address you provided is valid and correct.

同意 不同意

I have read and concur with the Site TermsPrivacy PolicyRules and Conventions on User Management of ZStack Cloud

Download

Not filled the basic info yet? Click here.

Invalid email address or mobile number.
同意 不同意

I have read and concur with the Site TermsPrivacy PolicyRules and Conventions on User Management of ZStack Cloud

Email Us

contact@zstack.io
ZStack Training and Certification
Enter at least 2 characters.
Invalid mobile number.
Enter at least 4 characters.
Invalid email address.
Wrong code. Try again. Send Code Resend Code (60s)

同意 不同意

I have read and concur with the Site TermsPrivacy PolicyRules and Conventions on User Management of ZStack Cloud

Email Us

contact@zstack.io
Request Trial
Enter at least 2 characters.
Invalid mobile number.
Enter at least 4 characters.
Invalid email address.
Wrong code. Try again. Send Code Resend Code (60s)

同意 不同意

I have read and concur with the Site TermsPrivacy PolicyRules and Conventions on User Management of ZStack Cloud

Email Us

contact@zstack.io

The download link is sent to your email address.

If you don't see it, check your spam folder, subscription folder, or AD folder. After receiving the email, click the URL to download the documentation.

The download link is sent to your email address.

If you don't see it, check your spam folder, subscription folder, or AD folder.
Or click on the URL below. (For Internet Explorer, right-click the URL and save it.)

Thank you for using ZStack products and services.

Submit successfully.

We'll connect soon.

Thank you for using ZStack products and services.