Performance TOP5

Performance TOP5 is a visual performance monitoring page. This page provides a direct and simple display of the top 5 monitoring metrics of various resources, such as VM instances, routers, hosts, L3 networks, and VIPs. With Performance TOP5, you can directly manage the real-time health state of resources on the Cloud, and improve the O&M efficiency.

  • Host tab page:

    On the host tab page, the Cloud analyzes utilizations of CPUs, memories, disks, and network resources of all hosts under the current zone. In addition, the Cloud provides a real-time monitoring display of top 5 resources by taking average CPU utilization, memory utilization, disk read/write IPOS, used disk capacity in percent, disk read/write speed, NIC out/in speed, NIC out/in package rate, and NIC out/in error rate as performance metrics. Different colors of real-time percentage ranks and progress bars will directly indicate resource utilizations or performance bottlenecks, as shown in Host Performance TOP5.

  • VM tab page:
    The VM instance page includes external monitoring and internal monitoring.
    • Similar to the host tab page, the external monitoring page provides a utilization analysis of CPUs, memories, disks, and network resources of all VM instances under the current zone. In addition, the external monitoring page provides a real-time monitoring display of top 5 resources by taking average CPU utilization, memory utilization, memory free (idle) in percent, disk read/write IPOS, disk read/write speed, NIC out/in speed, NIC out/in package rate, and NIC out/in error rate as performance metrics. Different colors of real-time percentage ranks and progress bars will directly indicate resource utilizations or performance bottlenecks.
    • To check the internal monitoring of VM instances, install an agent. On the internal monitoring page, the Cloud analyzes utilizations of CPUs, memories, and disks of all VM instances under the current zone. In addition, the Cloud provides a real-time monitoring display of top 5 resources by taking average CPU utilization, memory utilization, memory free in percent, used disk capacity in percent, and disk free in percent as performance metrics. Different colors of real-time percentage ranks and progress bars will directly indicate resource utilizations or performance bottlenecks, as shown in VM Internal Monitoring TOP5.
      Figure 1. VM Internal Monitoring TOP5


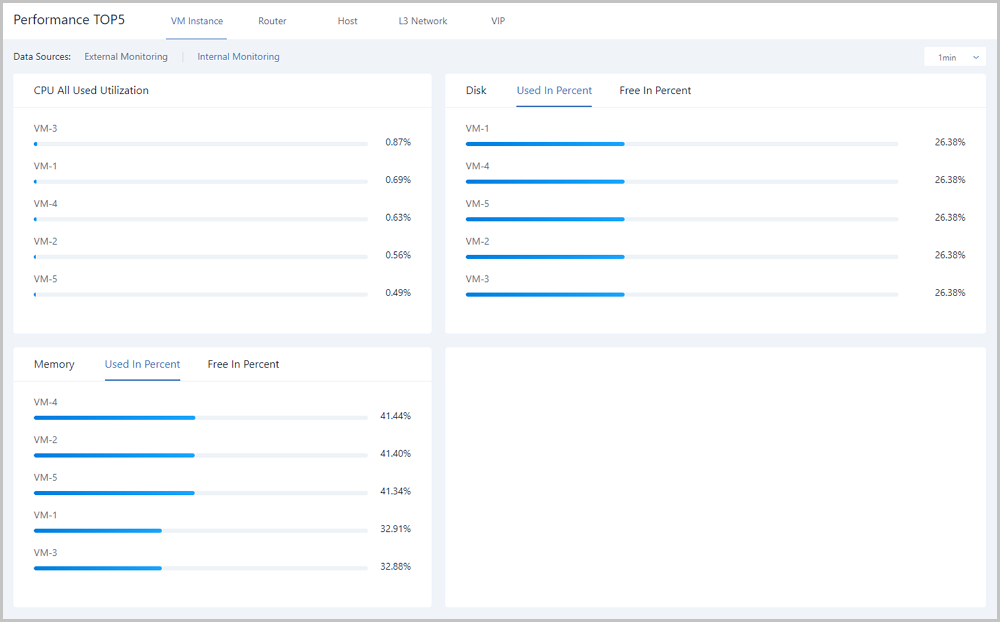
      Note: For memory data, internal monitoring is more accurate than external monitoring. We recommend that you use internal monitoring to monitor memory data.
  • Router tab page:
    The router tab page includes external monitoring and internal monitoring.
    • Similar to the VM instance tab page, the external monitoring page provides a utilization analysis of CPUs, memories, disks, and network resources of all routers (including vRouters and VPC vRouters) under the current zone. In addition, the external monitoring page provides a real-time monitoring display of top 5 resources by taking average CPU utilization, memory utilization, memory free (idle) in percent, disk read/write IPOS, disk read/write speed, NIC out/in speed, NIC out/in package rate, and NIC out/in error rate as performance metrics. Different colors of real-time percentage ranks and progress bars will directly indicate resource utilizations or performance bottlenecks.
    • To check the internal monitoring of routers, install an agent. On the internal monitoring page, the Cloud analyzes utilizations of CPUs, memories, and disks of all VM instances under the current zone. In addition, the Cloud provides a real-time monitoring display of top 5 resources by taking average CPU utilization, memory utilization, memory free in percent, used disk capacity in percent, and disk free in percent as performance metrics. Different colors of real-time percentage ranks and progress bars will directly indicate resource utilizations or performance bottlenecks.
  • VIP tab page:

    On the VIP tab page, the Cloud analyzes network transmission performances of all VIPs under the current zone. In addition, the Cloud provides a real-time monitoring display of top 5 resources by taking network in (bytes), network out (bytes), network packets in (count), and network packets out (count) as performance metrics. Different colors of real-time percentage ranks and progress bars will directly indicate performance bottlenecks of some VIPs, as shown in VIP Performance TOP5.

  • L3 network tab page:

    On the L3 network tab page, the Cloud analyzes IP resource utilizations of all L3 networks under the current zone. In addition, the Cloud provides a real-time monitoring display of top 5 resources by taking used IP in percent, used IP count, available IP in percent, and available IP count as performance metrics. Different colors of real-time percentage ranks and progress bars will directly indicate IP resource utilizations of L3 networks, as shown in L3 Network Performance TOP5.

More Information

  • On the performance top 5 page at the upper right, select the time drop-down box to set data collection periods for host, VM instance, router, and VIP. Optional period: 1 minute | 1 hour | 24 hours | 1 week, and 1 month. The L3 network tab page does not have data collection period settings.
  • A regular account can check the performance top 5. Similar to an admin, the regular account can directly and easily check top 5 information of various monitoring metrics such as VM instances, routers, VIPs, and L3 networks on the performance top 5 page. In this regard, you can directly manage the real-time health state of resources on the Cloud, and can quickly locate problems.
  • A project member can also check the performance top 5. Similar to an admin, the project member can directly and easily check top 5 information of various monitoring metrics such as VM instances, routers, L3 networks, and VIPs on the performance top 5 page. In this regard, project member can directly manipulate the real-time health state of resources on the Cloud, and can quickly locate problems.

Performance Analysis

ZStack provides real-time performance analysis of the running VM instances, vRouters, and hosts. Specifically,
  • VM Instance, vRouter, and Host: Display the name, average CPU utilization, memory utilization, disk read or write speed, and NIC in or out speed.
  • L3 Network: Display the name, used IP count, used IP percentage, available IP count, and available IP percentage.
  • VIP: Display the name, inbound traffic in bytes, inbound traffic in packages, outbound traffic in bytes, and outbound traffic in packages.
  • Backup Storage: Display the name and the available backup storage capacity in percent.
  • You can customize data ranges (defaults to 1 minute). By clicking the time range button at the upper right, you can specify the start time and end time to check data of performance analysis within different time ranges.
  • The left-side filter allows you to check custom performance analysis list according to the resource range and the filter entry. Specifically, a VM instance, router, and VIP allow you to display a custom performance analysis list according to owners.
  • By default, each page displays 20 pieces of information. You can choose to display resource counts on a single page. Options: 10 | 20 | 50 | 100. In addition, you can turn your pages by clicking the left arrow button and the right arrow button.
  • By clicking the download button at the upper right, you can export a CVS file of resource information.
  • A regular account or project member can check performance analysis. Similar to an admin, the regular account or project member can directly and easily check real-time utilizations of VM instances, routers, L3 networks, and VIPs on the performance analysis page.
  • A time range can be selected to check performance analysis data. Note that these data are average values collected within the selected time range. To obtain the currently detailed resource data, go to the resource details page.

Capacity Management

Capacity Management provides a direct display of core resource capacity statistics on the cloud. With Capacity Management, various storage metrics on the Cloud are analyzed and rearranged to display detailed capacities of core resources in card. In addition, Top 10 resource capacities are displayed so that you can directly manage resource utilizations on the cloud.

The Capacity Management page mainly includes the following two sections:
  • Upper section: Display detailed capacities of various core resources in card, including primary storages, backup storages, compute nodes, VM instances, volumes, images, snapshots, and management nodes.
  • Lower section: Sort top 10 capacities of various core resources, including hosts, primary storages, backup storages, VM instances, images, VM instances, volumes, and snapshots.
Note:
  • The resource capacities displayed in this page are all actual physical capacities of your resources.
  • The data on this page are all static. To obtain the latest data, refresh this page each time when you go to this page.
  • Currently, capacity statistics of primary storages can be analyzed and provided, such as LocalStorage, Shared Block, and Ceph.
  • Currently, capacity statistics of backup storages can be analyzed and provided, such as ImageStore and Ceph.
Notice
  • If your primary storages or backup storages are disconnected, statistics accuracies of associated resource capacity cards and top 10 resource capacities will be affected.
  • After you delete or reconnect primary storages and backup storages, wait a while and refresh the capacity management page to obtain the latest capacity data.


Back to Top

Download

Already filled the basic info?Click here.

Enter at least 2 characters.
Invalid mobile number.
Enter at least 4 characters.
Invalid email address.
Wrong code. Try again. Send Code Resend Code (60s)

An email with a verification code will be sent to you. Make sure the address you provided is valid and correct.

Download

Not filled the basic info yet? Click here.

Invalid email address or mobile number.

Email Us

contact@zstack.io
ZStack Training and Certification
Enter at least 2 characters.
Invalid mobile number.
Enter at least 4 characters.
Invalid email address.
Wrong code. Try again. Send Code Resend Code (60s)

Email Us

contact@zstack.io
Request Trial
Enter at least 2 characters.
Invalid mobile number.
Enter at least 4 characters.
Invalid email address.
Wrong code. Try again. Send Code Resend Code (60s)

Email Us

contact@zstack.io

The download link is sent to your email address.

If you don't see it, check your spam folder, subscription folder, or AD folder. After receiving the email, click the URL to download the documentation.

The download link is sent to your email address.

If you don't see it, check your spam folder, subscription folder, or AD folder.
Or click on the URL below. (For Internet Explorer, right-click the URL and save it.)

Thank you for using ZStack products and services.

Submit successfully.

We'll connect soon.

Thank you for using ZStack products and services.