ZStack Cloud Platform
Single Server, Free Trial for One Year
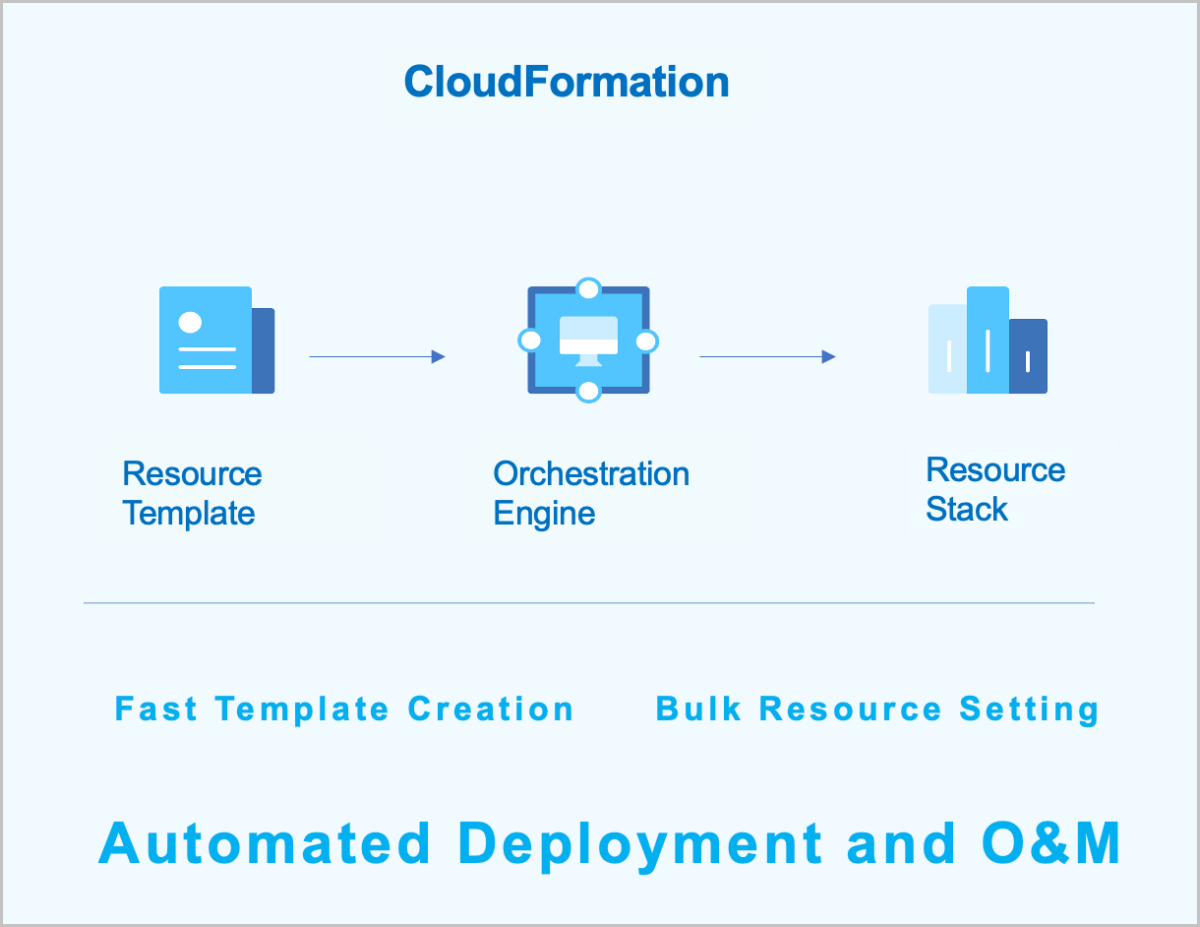
CloudFormation: CloudFormation is a service that simplifies the management of cloud resources and automates deployment and O&S. You can create a stack template to configure cloud resources and their dependencies. This way, resources can be automatically configured and deployed in batches. CloudFormation provides easy management of the lifecycle of cloud resources and integrates automatic O&S into API and SDK.

In a dual-management node HA scenario, you can intuitively view the health status of each management node.
Monitoring and alarm supports monitoring time-series data (such as resource load and capacity data) and predefined system events. It pushes alarms to specified endpoints through the SNS. The supported alarm types include resource alarm, event alarm, and extended alarm. Supported endpoint types include system, email, DingTalk, WeCom, Lark, Webhook, SMS, Microsoft Teams, and SNMP Trap. Some resource alarms require an installed agent to function.

Prometheus provides time-series monitoring data. When monitoring business data, Prometheus uniformly collects different data.
In the Prometheus architecture, the Prometheus server does not directly monitor specific targets. Its core functions are data collection, storage, and providing external data query support. Therefore, to acquire sample data, such as the host CPU usage, an Exporter is used to periodically gather monitoring samples. ZStack Cloud employs both pull and push modes to collect monitoring data from different monitoring targets. When hosts or external VM metrics are the monitoring targets, the Prometheus service periodically uses the pull mode to collect data gathered by the Exporter on the hosts.
Additionally, due to network or security constraints, Prometheus might not be able to directly access the interiors of cloud VMs or bare metal servers. In such cases, a Pushgateway acts as an intermediary to facilitate data transfer. The data collection agent still uses an Exporter to gather monitoring metrics but employs a push mode to periodically send this data to the Pushgateway. Prometheus then uses its pull mode to collect the data from the Pushgateway, thereby achieving unified data collection.