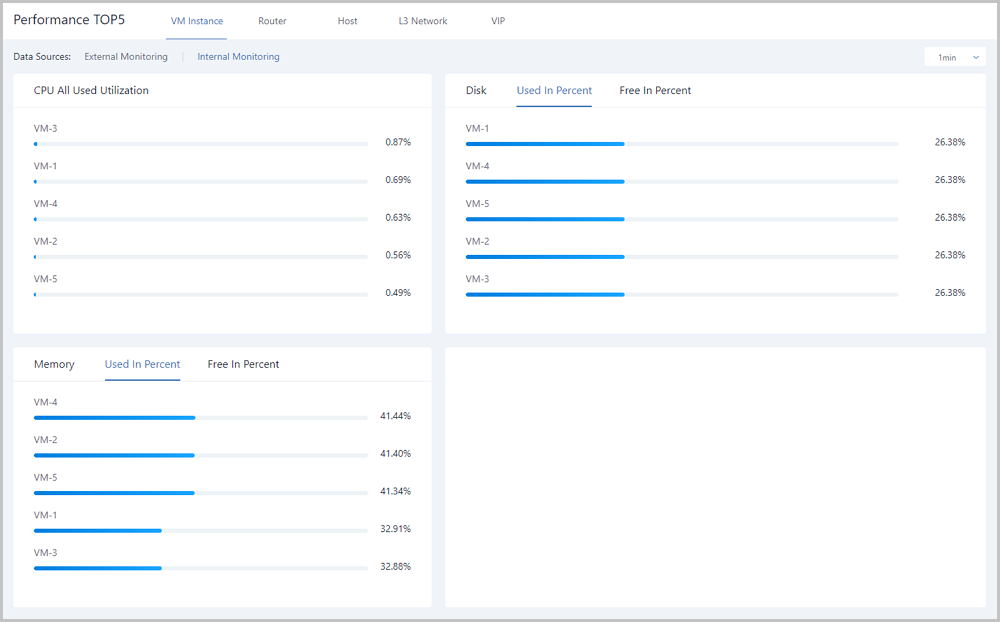
Performance TOP5 is a visual performance monitoring page. This page provides a direct and simple display of the top 5 monitoring metrics of various resources, such as VM instances, routers, hosts, L3 networks, and VIPs. With Performance TOP5, you can directly manage the real-time health state of resources on the Cloud, and improve the O&M efficiency.
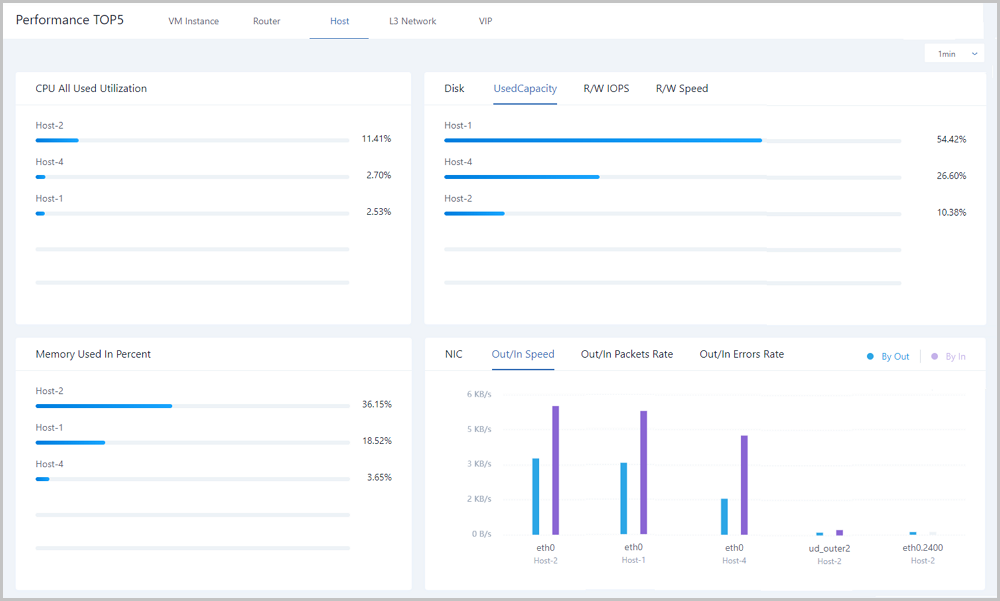
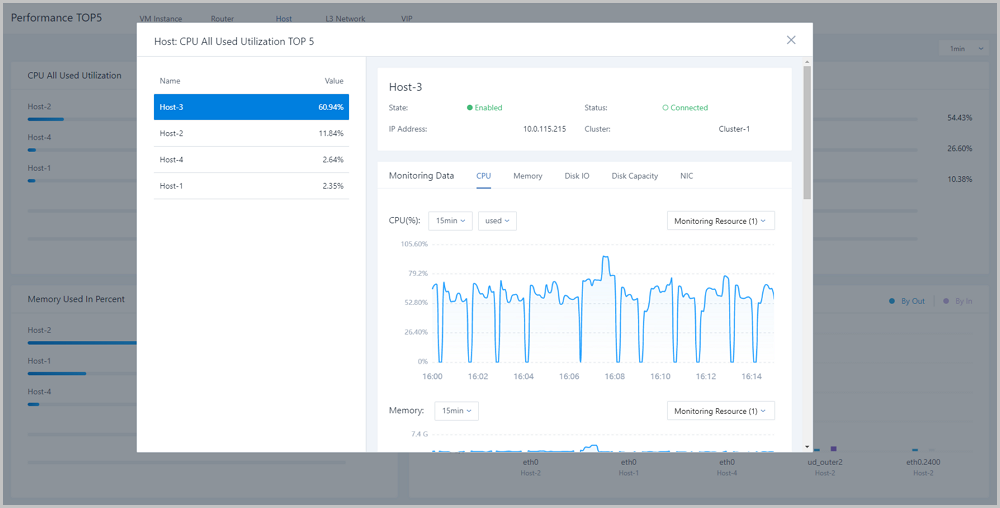
On the host tab page, the Cloud analyzes utilizations of CPUs, memories, disks, and network resources of all hosts under the current zone. In addition, the Cloud provides a real-time monitoring display of top 5 resources by taking average CPU utilization, memory utilization, disk read/write IPOS, used disk capacity in percent, disk read/write speed, NIC out/in speed, NIC out/in package rate, and NIC out/in error rate as performance metrics. Different colors of real-time percentage ranks and progress bars will directly indicate resource utilizations or performance bottlenecks, as shown in Host Performance TOP5.
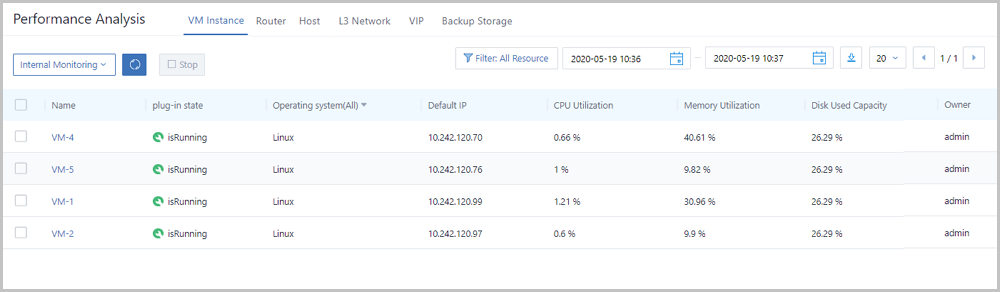
 Note: For memory data, internal monitoring is more accurate than external monitoring. We recommend that you use internal monitoring to monitor memory data.
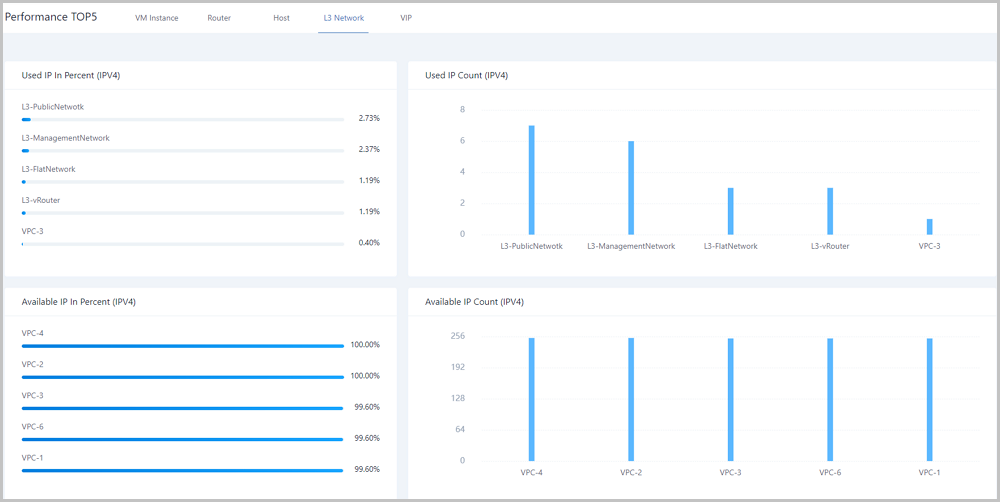
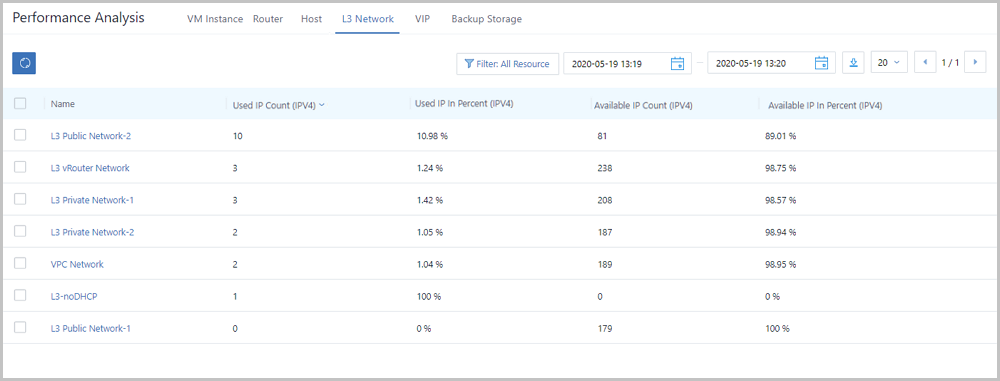
On the L3 network tab page, the Cloud analyzes IP resource utilizations of all L3 networks under the current zone. In addition, the Cloud provides a real-time monitoring display of top 5 resources by taking used IP in percent, used IP count, available IP in percent, and available IP count as performance metrics. Different colors of real-time percentage ranks and progress bars will directly indicate IP resource utilizations of L3 networks, as shown in L3 Network Performance TOP5.
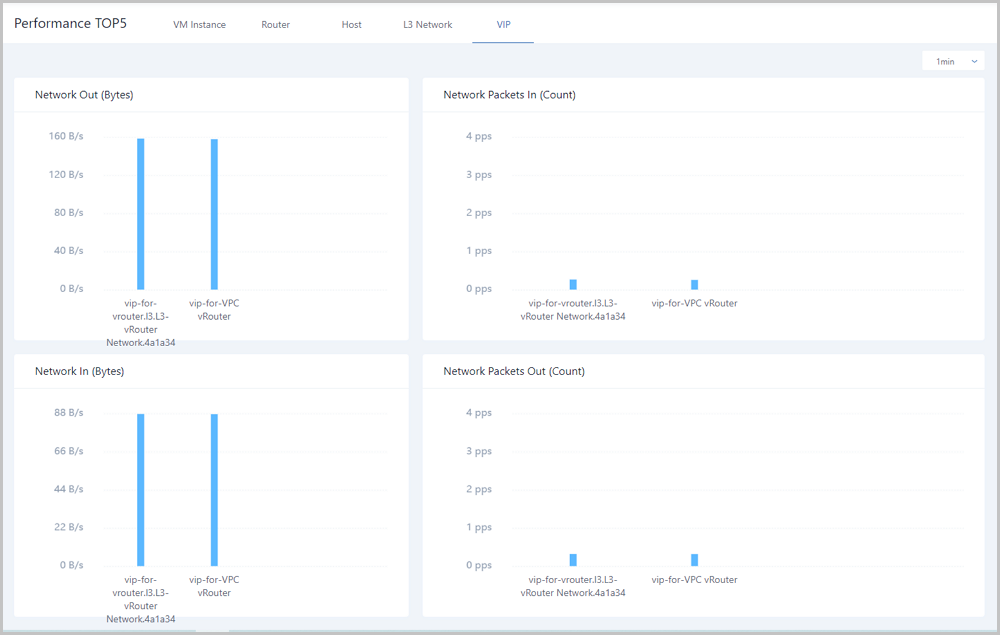
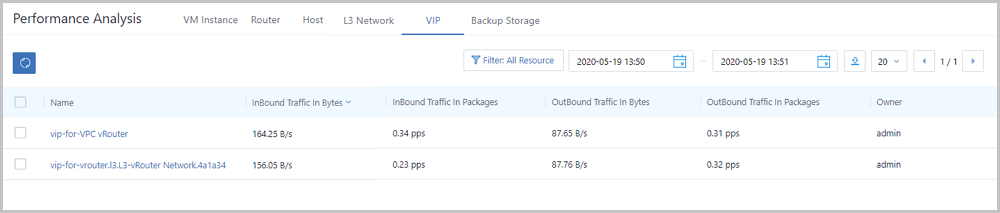
On the VIP tab page, the Cloud analyzes network transmission performances of all VIPs under the current zone. In addition, the Cloud provides a real-time monitoring display of top 5 resources by taking network in (bytes), network out (bytes), network packets in (count), and network packets out (count) as performance metrics. Different colors of real-time percentage ranks and progress bars will directly indicate performance bottlenecks of some VIPs, as shown in VIP Performance TOP5.
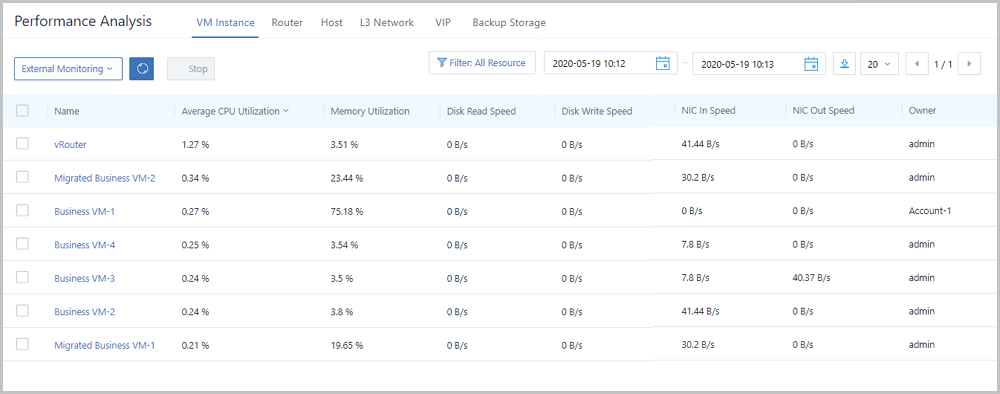
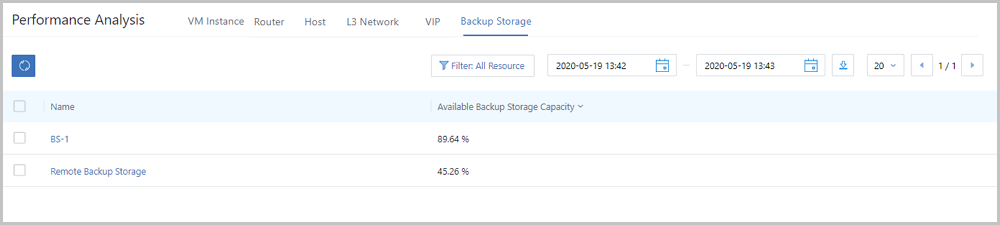
Performance Analysis is a performance statistics page designed for O&M personnel. This page takes resources as a unit to directly and simply display monitoring metrics of various resources, such as VM instances, routers, hosts, L3 networks, VIPs, and backup storages at different time ranges. With Performance Analysis, the O&M personnel can directly manipulate the health status of resources on the Cloud.
 Note:
Note: 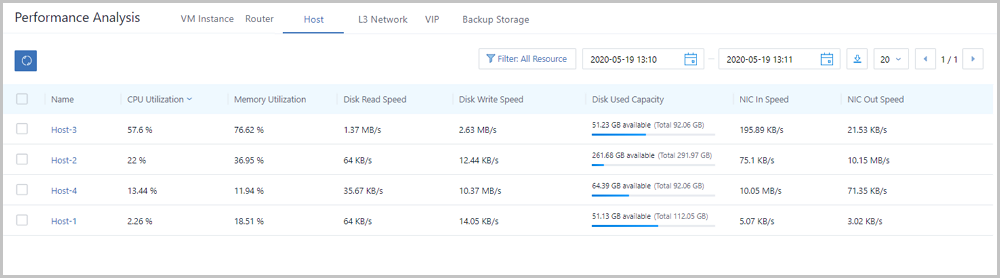
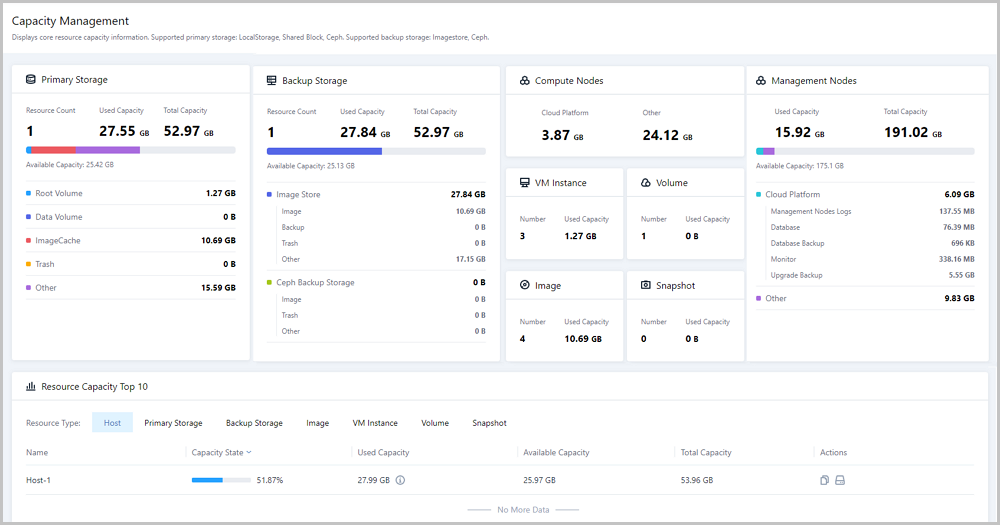
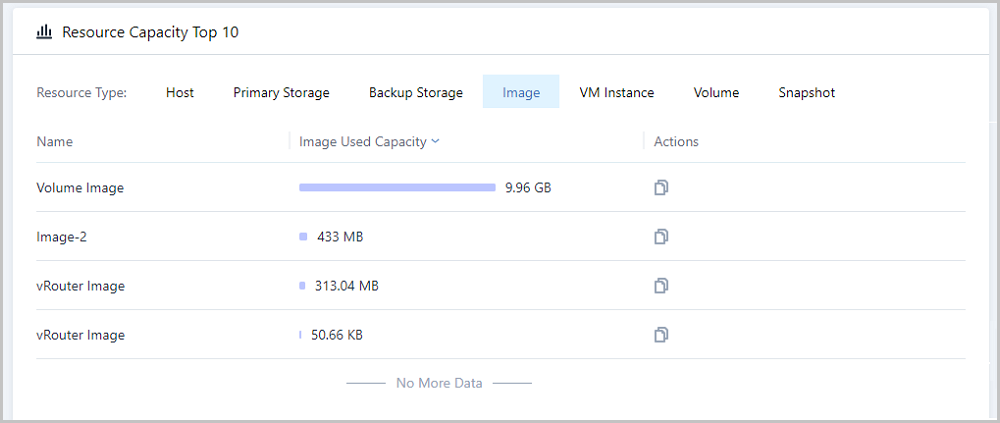
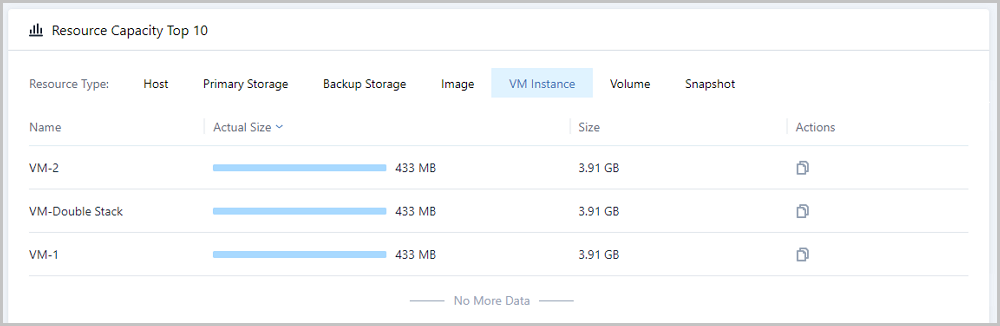
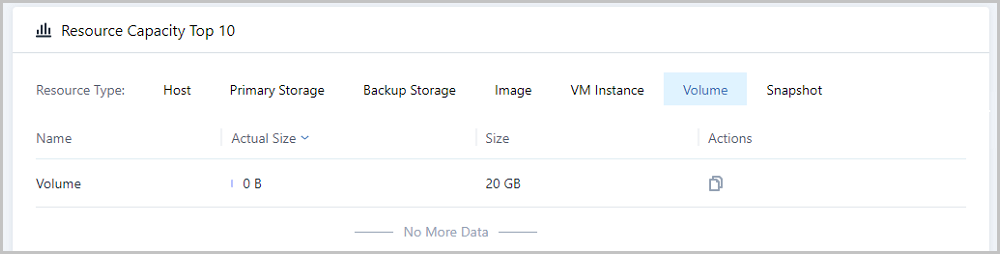
Capacity Management provides a direct display of core resource capacity statistics on the cloud. With Capacity Management, various storage metrics on the Cloud are analyzed and rearranged to display detailed capacities of core resources in card. In addition, Top 10 resource capacities are displayed so that you can directly manage resource utilizations on the cloud.
In the navigation pane of the ZStack Private Cloud UI, choose to enter the Capacity Management page.
 Note:
Note: | Data Type | Description |
|---|---|
| Root volume | Root volume: the system volumes of VM instances to support the system running of the VM instances. Root volume capacity: the total capacity of all root volumes under the current zone. Note: Statistics of root volume capacities include:
|
| Data volume | Data volume: the data volumes used by VM instances. Generally, the data volume is used for extensible storages. Data volume capacity: the total capacity of all data volume under the current zone. |
| Image cache | Image cache: When you create a VM instance or volume for the first time, images in your backup storage will be downloaded to your primary storage to serve as image caches. Image cache capacity: the total capacity of image caches in all primary storages under the current zone. |
| Trash | Trash: the residual source files in the source primary storage when you migrate VM instances or volumes across primary storages. Trash capacity: the total trash capacity of all primary storages under the current zone. |
| Others | Others: the operating system, logs, and third-party software stored in the primary storage. Other capacities: the total capacity of other data in all primary storages under the current zone. |
Note: We do not recommend that you deploy multiple local storages by using the same physical disk. If you do, capacity statistics of primary storages will not be accurate.| Backup Storage Type | Data Type | Description |
|---|---|---|
| ImageStore | Image | Image: the image template files used by VM instances or volumes. Image capacity: the total image capacity of all ImageStore backup storages under the current zone. |
| Backup | Backup: the stored backup files of all ImageStore backup storages that serve as local backup storages. Backup capacity: the total backup capacity of all ImageStore backup storages that serve as local backup storages under the current zone. | |
| Trash | Trash: the residual source files in the source primary storage when you migrate images across ImageStore backup storages. Trash capacity: the total trash capacity of all ImageStore backup storages under the current zone. Note: Currently, images cannot be migrated across ImageStore backup storages. In this regard, statistics of the corresponding trash capacities are excluded. | |
| Others | Others: the operating system, logs, and third-party software stored in ImageStore backup storages. Other capacity: the total capacity of other data in all ImageStore backup storages under the current zone. | |
| Ceph | Image | Image: the image template files used by VM instances or volumes. Image capacity: the total image capacity of all Ceph backup storages under the current zone. |
| Trash | Trash: the residual source files in the source primary storage when you migrate images across Ceph backup storages. Trash capacity: the total trash capacity of all Ceph backup storages under the current zone. | |
| Others | Others: the operating system, logs, and third-party software stored in Ceph backup storages. Other capacity: the total capacity of other data in all Ceph backup storages under the current zone. |
Note: Capacity statistics of root volumes only include system data of VM instances.Note: Note: Snapshots on Ceph primary storages do not occupy capacities, so statistics of the corresponding snapshot capacity are excluded.| First-Level Data Type | Second-Level Data Type | Description |
|---|---|---|
| Cloud platform | MN log | MN log: the operation log files of the management node. MN log capacity:
|
| Database | Database: the MN database used for storing and managing all MN databases of the cloud. Database capacity:
| |
| Database backup | Database backup: the backup data of the MN database. Database backup capacity:
| |
| Monitoring | Monitoring: the cloud monitoring data and audit data stored in the management node. Monitoring capacity:
| |
| Upgrade backup | Upgrade backup: the backup data of the management node database and the configuration files when the cloud upgrades. Upgrade backup capacity:
| |
| Others | / | Others: all other data stored in the management node apart from the associated cloud data (MN log, database, database backup, monitoring, and upgrade backup) Other capacity:
|
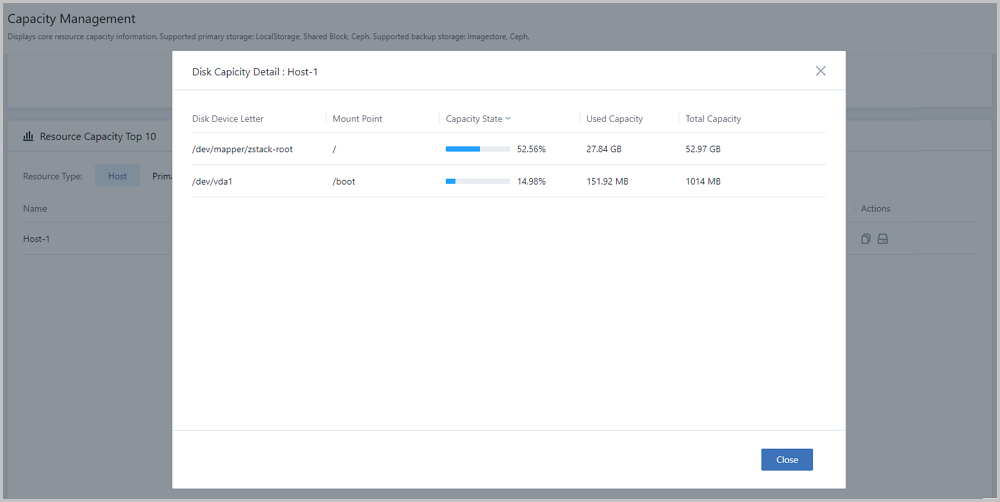
Note: Capacity state = used capacity / total capacityNote: Used capacity details of different partition directory are displayed, including:Note: Total capacity = used capacity + available capacity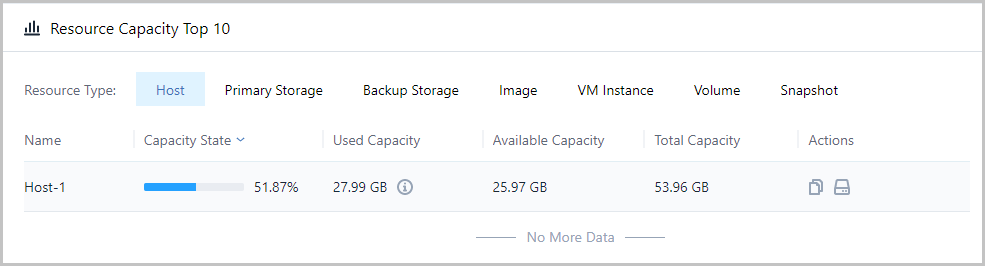
 Note: Capacity state = used capacity / total capacityNote: Capacity details of different types of data can be displayed.Note: Statistics of root volume capacities include:Note: Total capacity = used capacity + available capacity
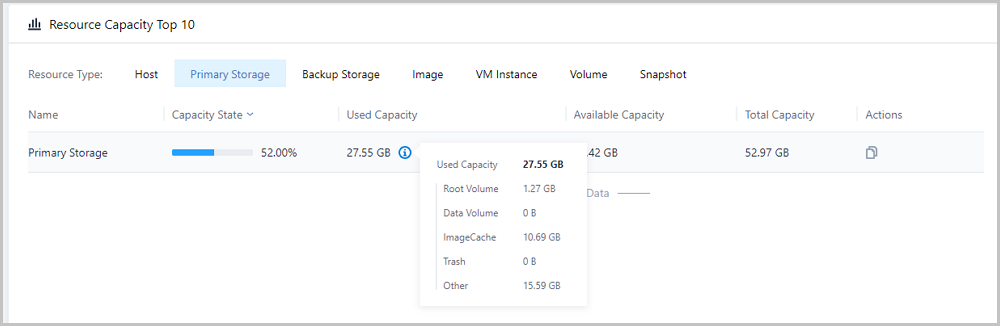 Note: Capacity state = used capacity / total capacityNote: Capacity details of different types of data can be displayed.Note: Currently, images cannot be migrated across ImageStore backup storages. In this regard, statistics of the corresponding trash capacities are excluded.Note: Total capacity = used capacity + available capacity
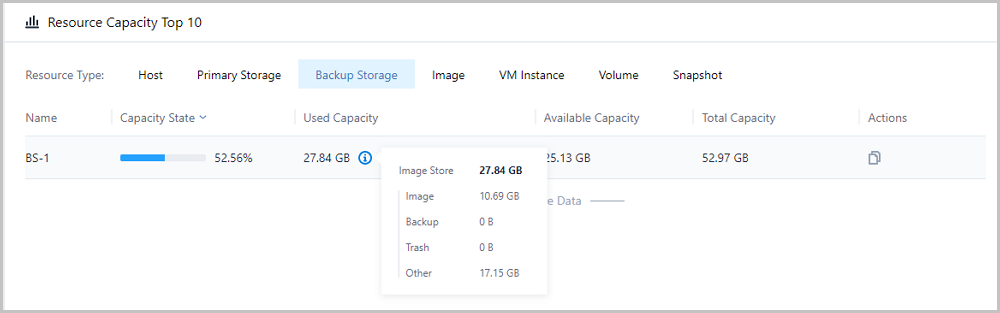
 Note:
Note: 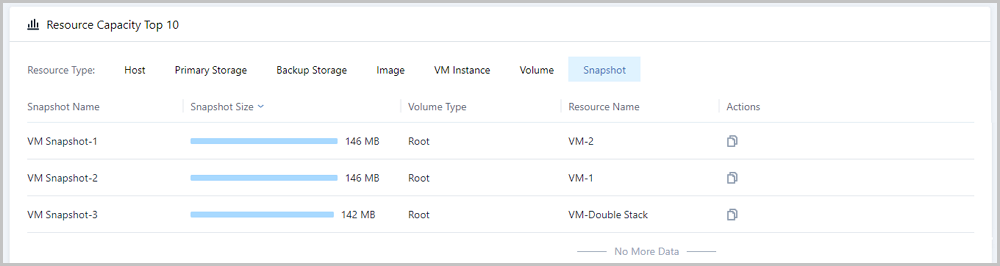
© 2023, Shanghai Yunzhou Information and Technology Ltd (云轴科技). All Rights Reserved.
Back to Top
Email Us
contact@zstack.ioEmail Us
contact@zstack.ioEmail Us
contact@zstack.ioThe download link is sent to your email address.
If you don't see it, check your spam folder, subscription folder, or AD folder. After receiving the email, click the URL to download the documentation.Thank you for using ZStack products and services.
Submit successfully.
We'll connect soon.Thank you for using ZStack products and services.

